
Real-Time LLM Cost Monitoring Dashboard: Token Efficiency & Quality...
Introduction
Production LLM deployments hemorrhage budget when teams cannot correlate token spend with output quality in real time. This article delivers an engineering blueprint for real-time LLM cost monitoring dashboard systems that fuse token-efficiency KPIs, live regression alerts, and explicit cost/quality tradeoff controls—transforming opaque inference spend into actionable, attributable operational data.
Consider a failure scenario: your customer-facing RAG pipeline silently shifts to a higher-context model variant after a deployment. Token costs triple overnight. Quality scores (measured by LLM-as-judge) actually degrade 12% due to increased hallucinations from over-long retrieved contexts. Without real-time telemetry, this regression persists for 11 days—long enough to consume 340% of the quarterly AI budget allocation and trigger a customer churn spike detected only in quarterly business reviews. This is not hypothetical; it is the default mode of operation for teams lacking unified spend-quality observability.
Executive Summary
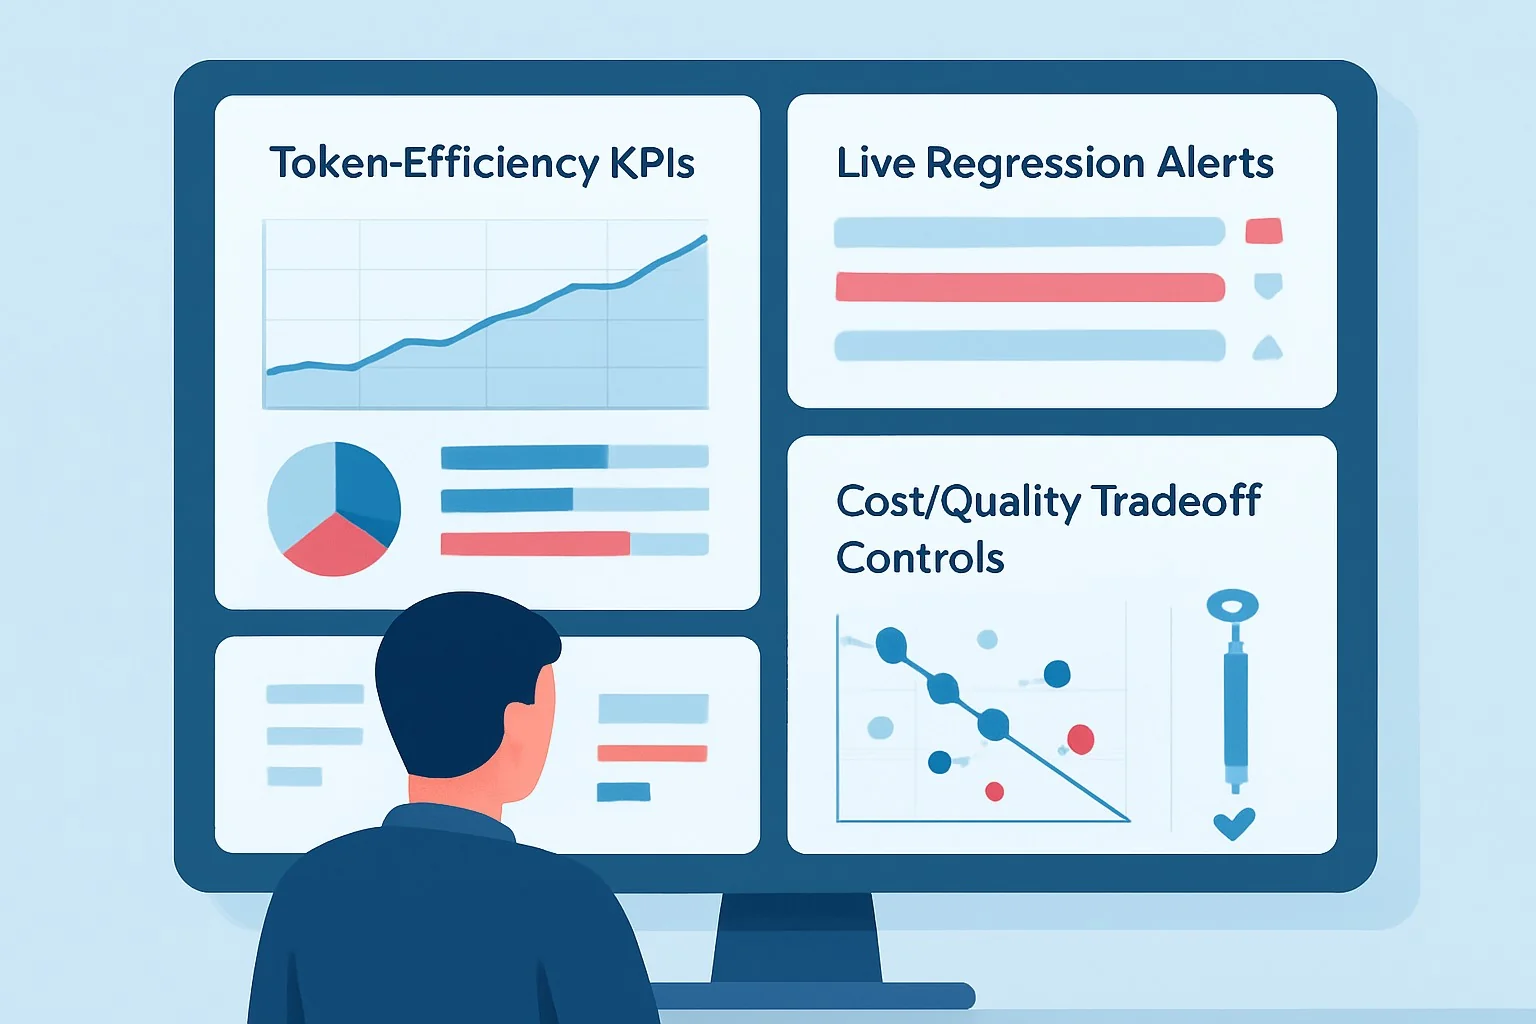
TL;DR: A production-grade real-time LLM cost monitoring dashboard unifies token accounting, quality regression detection, and cost/quality tradeoff levers into a single control surface, enabling sub-minute detection of spend anomalies and automated model fallback decisions.
- Token-efficiency KPIs must be model-normalized—raw token counts are meaningless without per-model cost weights and task-complexity baselines.
- Live regression alerts require dual-threshold triggering—cost variance AND quality degradation must fire together to avoid alert fatigue from benign model swaps.
- Cost/quality tradeoff controls need automated actuators—human-in-the-loop approval scales poorly beyond 10K daily inference calls.
- Real-time means <60s end-to-end latency from token generation to dashboard visibility, including attribution to tenant, model, and prompt template.
- LLM token efficiency metrics decay without recalibration—baseline quality scores drift with model versions, data distributions, and evaluator prompt aging.
- Production implementation requires three telemetry streams—token accounting, quality evaluation, and business outcome correlation.
Quick Answers to Likely Queries
Q: What latency should a real-time LLM cost monitoring dashboard target?
A: End-to-end from inference completion to dashboard visibility: p95 < 60s, p99 < 120s, with quality evaluation async to avoid blocking the critical path.
Q: How do you detect quality regression without ground truth labels?
A: Deploy LLM-as-judge evaluators with consistency checks (same input, multiple evaluations), calibrated against historical human-rated samples with >0.7 Spearman correlation.
Q: What is the minimum viable cost/quality tradeoff automation?
A: Model fallback rules triggered by per-request estimated cost exceeding budgeted ceiling AND predicted quality score below task-specific threshold, with escalation to human review for first 10 auto-decisions.
How Real-Time LLM Spend & Quality Dashboards Work Under the Hood
Architecture Overview
A production LLM spend observability system ingests three asynchronous telemetry streams and converges them in a time-series analytical store:
- Token accounting stream: Prompt tokens, completion tokens, cached context tokens (for models supporting prefix caching), model identifier, pricing tier, and request metadata. Emitted from inference gateway or proxy layer (e.g., LiteLLM, Kong with custom plugin, or in-house routing layer).
- Quality evaluation stream: Structured outputs from LLM-as-judge, heuristic evaluators (regex, JSON schema validation), and human feedback where available. Evaluated asynchronously to avoid latency impact on inference path.
- Business outcome stream: Conversion events, support ticket escalation, user retention signals—correlated via request trace IDs.
These streams merge on trace_id + timestamp in an OLAP database (ClickHouse, Apache Druid, or BigQuery with streaming inserts). The dashboard queries pre-aggregated materialized views with sub-second latency for recent data, falling back to raw scans for deep historical analysis.
Token-Efficiency KPI Computation
Raw token counts are operationally useless without normalization. We define four production token usage KPIs for AI:
- Normalized Token Cost (NTC):
NTC = (prompt_tokens × prompt_cost_per_1k + completion_tokens × completion_cost_per_1k) / task_complexity_score. Task complexity is derived from historical human time-to-complete for equivalent tasks, or embedding-space distance from canonical examples. - Token Velocity: Tokens per wall-clock second for streaming responses; identifies throughput regressions from model provider degradation.
- Completion Ratio:
completion_tokens / prompt_tokens. Spikes indicate runaway generation (verbosity failures) or truncated outputs (quality failures). - Cache Hit Rate:
cached_tokens / total_prompt_tokens. Critical for systems using prefix caching (Anthropic, Gemini); <30% suggests prompt template inefficiency.
Live Regression Alert Engine
Live regression alerts for LLMs require dual-threshold logic to prevent noise. A single-threshold alert on cost variance fires on every benign model upgrade; a single-threshold alert on quality degradation fires on every data distribution shift. The production pattern:
ALERT_CONDITION = (
  (cost_per_request_p50 > 1.5 × baseline_7d_median) AND
  (quality_score_p50 < 0.85 × baseline_7d_median)
) OR (
  (quality_score_p50 < 0.70 × baseline_7d_median) AND
  (cost_per_request_p50 > 1.2 × baseline_7d_median)
)
The asymmetric thresholds reflect operational reality: cost spikes without quality impact warrant investigation but not paging; severe quality degradation even at modest cost increase demands immediate response. Baselines use exponentially weighted moving averages with 7-day half-life, recalibrated weekly against held-out human evaluations.
Cost/Quality Tradeoff Control Surface
The LLM cost quality tradeoff is not a single Pareto frontier but a dynamic control problem. The dashboard exposes three actuator levels:
- Per-request routing: Model selection based on estimated cost and predicted quality for the specific input. Requires lightweight classifier (logistic regression on embedding features suffices) trained on historical (input, model, cost, quality) tuples.
- Per-session budget enforcement: Cumulative spend ceiling with quality-fallback: when 80% of budget consumed, downgrade to cheaper model with quality threshold check; when 95% consumed, hard stop with graceful degradation message.
- Per-tenant rate shaping: Dynamic pricing signals back to tenant via API headers (
X-LLM-Cost-This-Request,X-LLM-Budget-Remaining), enabling client-side optimization.
Implementation: Production Patterns
Phase 1: Telemetry Instrumentation
Instrument at the inference gateway, not the application layer, to ensure completeness. A minimal OpenTelemetry-style span structure:
{
  "trace_id": "abc123",
  "span_id": "gateway-001",
  "timestamp": "2024-01-15T09:23:47.123Z",
  "model": "claude-3-sonnet-20240229",
  "tokens": {
    "prompt": 1247,
    "completion": 342,
    "cached": 800
  },
  "cost_usd": 0.00471,
  "latency_ms": 1843,
  "quality": {
    "evaluator": "llm-as-judge-v2",
    "score": 0.87,
    "confidence": 0.92
  },
  "tenant_id": "org_42",
  "prompt_template_version": "rag-v3.2"
}
The LLM observability pipeline covering trace, diff, and bill provides deeper instrumentation patterns for RAG-specific quality attribution and token lineage tracking that this dashboard consumes.
Phase 2: Aggregated KPI Computation
Materialized view schema in ClickHouse for real-time rollup:
CREATE MATERIALIZED VIEW llm_kpi_1min
ENGINE = SummingMergeTree()
PARTITION BY toYYYYMMDD(minute)
ORDER BY (tenant_id, model, prompt_template_version, minute)
AS SELECT
  toStartOfMinute(timestamp) AS minute,
  tenant_id,
  model,
  prompt_template_version,
  count() AS request_count,
  sum(cost_usd) AS total_cost,
  quantilesExact(0.50, 0.95, 0.99)(cost_usd) AS cost_p50_p95_p99,
  quantilesExact(0.50, 0.95, 0.99)(quality.score) AS quality_p50_p95_p99,
  sum(tokens.prompt) AS prompt_tokens_total,
  sum(tokens.completion) AS completion_tokens_total,
  avg(tokens.completion / tokens.prompt) AS completion_ratio_avg
FROM llm_traces
GROUP BY minute, tenant_id, model, prompt_template_version;
Phase 3: Alerting and Control Loop
Alert evaluation using scheduled queries against the materialized view, pushed to PagerDuty/Slack for human response or to automated actuator for pre-approved actions:
# Pseudocode for dual-threshold alert evaluation
import numpy as np
from scipy.stats import norm

def evaluate_regression(tenant_id, model, window_minutes=15):
    recent = query_kpi(tenant_id, model, last_n_minutes=window_minutes)
    baseline = query_kpi(tenant_id, model,
                         last_n_minutes=window_minutes,
                         offset_days=7)  # Same time-of-day, 7 days prior

    # Cost z-score with quality gate
    cost_z = (recent.cost_p50 - baseline.cost_p50) / baseline.cost_p50_std
    quality_ratio = recent.quality_p50 / baseline.quality_p50

    if cost_z > 2.0 and quality_ratio < 0.85:
        return AlertLevel.PAGE, "Cost+Quality dual regression"
    elif cost_z > 3.0:
        return AlertLevel.INVESTIGATE, "Cost spike, quality stable"
    elif quality_ratio < 0.70:
        return AlertLevel.PAGE, "Severe quality degradation"

    return AlertLevel.NONE, None
Phase 4: Cost/Quality Tradeoff Automation
The automated actuator requires a policy configuration with escalation boundaries:
class TradeoffPolicy:
    def __init__(self):
        self.model_tiers = {
            'claude-3-opus': {'cost_mult': 3.0, 'quality_floor': 0.95},
            'claude-3-sonnet': {'cost_mult': 1.0, 'quality_floor': 0.90},
            'claude-3-haiku': {'cost_mult': 0.25, 'quality_floor': 0.80}
        }
        self.auto_actions = {
            'downgrade': True,      # Auto-downgrade if quality preserved
            'upgrade': False,       # Human approval required
            'hard_stop': False      # Human approval required
        }

    def select_model(self, estimated_complexity, budget_remaining,
                     quality_requirement):
        candidates = [
            m for m, spec in self.model_tiers.items()
            if spec['quality_floor'] >= quality_requirement
        ]
        # Sort by cost, select cheapest meeting quality bar
        # Override if budget exhausted
        if budget_remaining < 0.05:  # 5% remaining
            return 'claude-3-haiku', 'BUDGET_EXHAUSTED'
        return candidates[0], 'OPTIMAL'
Comparisons & Decision Framework
Build vs. Buy: Dashboard Infrastructure
| Approach | Latency | Customization | Maintenance Burden | When to Choose |
|---|---|---|---|---|
| Custom (ClickHouse + Grafana) | <10s | Unlimited | High (2-3 FTE) | >$500K/month LLM spend, >10 models, multi-tenant |
| Managed (LangSmith, Weights & Biases) | 30-120s | Medium | Low | <$100K/month, standard model set, rapid iteration |
| Hybrid (OpenTelemetry + custom aggregators) | <30s | High | Medium | Existing observability investment, compliance requirements |
Decision Checklist for Implementation
- Budget threshold for real-time investment: >$50K/month LLM spend justifies dedicated engineering; below this, managed solutions suffice.
- Multi-tenancy requirement: If per-tenant chargeback needed, custom attribution layer mandatory—managed tools lack granular cost allocation. The per-tenant LLM cost attribution and chargeback architecture details the lineage and allocation mechanics this dashboard consumes.
- Quality evaluation latency tolerance: Sub-5-minute quality feedback requires streaming evaluators; batch evaluation (hourly) suffices for non-interactive use cases.
- Automated action risk appetite: Financial services and healthcare typically require human approval for model changes; consumer applications can automate broader action sets.
- Existing FinOps maturity: Teams with established cloud cost allocation (AWS Cost Allocation Tags, Kubernetes labels) can extend patterns; greenfield teams face steeper organizational learning curve.
Failure Modes & Edge Cases
Silent Cost Inflation: Cached Token Miscounting
Anthropic's prefix caching charges 25% of base rate for cached tokens, but not all prompt prefixes qualify. Dashboards reporting "total tokens × base rate" overstate cost by 15-40% for cache-heavy workloads. Diagnostic: Compare provider invoice to dashboard-estimated cost; divergence >5% indicates cache accounting error. Mitigation: Parse provider-specific cache headers (anthropic-cache-control) and apply tiered pricing in telemetry pipeline.
Quality Evaluator Drift
LLM-as-judge scores inflate over time as evaluator models improve at pattern-matching rather than genuine quality assessment. Historical scores of 0.85 may equate to current scores of 0.75. Diagnostic: Maintain calibration set of 100 human-rated examples, re-evaluated monthly; compute evaluator-human correlation. Mitigation: Apply rolling z-score normalization to quality metrics, anchored to calibration set.
Alert Fatigue from A/B Tests
Intentional model experiments trigger dual-threshold alerts. Diagnostic: Tag all A/B traffic with experiment ID; modify alert query to exclude or separately threshold experimental cohorts. Mitigation: Separate "production" and "experiment" materialized views; experiment alerts route to experiment channel, not on-call.
Tenant Budget Race Conditions
Distributed enforcement of per-tenant budgets suffers from eventual consistency: two simultaneous requests both pass budget check, aggregate exceeds ceiling. Diagnostic: Monitor actual_spend - budget_ceiling overshoot metric. Mitigation: Implement pessimistic budget reservation (Redis INCR with TTL) for 95% of ceiling, with async reconciliation for final 5%.
Performance & Scaling
Latency Benchmarks
| Component | p50 | p95 | p99 | Notes |
|---|---|---|---|---|
| Token accounting (gateway to Kafka) | 5ms | 12ms | 25ms | Async fire-and-forget |
| Quality evaluation (async worker) | 800ms | 2.3s | 4.1s | Includes LLM-as-judge inference |
| Materialized view refresh | 1s | 3s | 8s | ClickHouse merge scheduling |
| Dashboard query (last 1 hour) | 45ms | 120ms | 340ms | Pre-aggregated |
| Dashboard query (last 30 days) | 180ms | 890ms | 2.1s | Rollup from daily partitions |
| End-to-end alert latency | 25s | 55s | 95s | Includes evaluation + notification |
Scaling Considerations
At >1M requests/day, the quality evaluation stream becomes the bottleneck. Production pattern: stratified sampling—evaluate 100% of high-value tenant requests, 10% of standard tier, 1% of batch/analytics workloads. The production LLM inference latency SLO framework provides complementary guidance on maintaining streaming latency commitments while adding observability overhead.
Storage Growth
Raw trace retention: 30 days hot (SSD), 90 days warm (object storage), 2 years cold (Glacier/S3 Glacier). Aggregated KPIs: indefinite retention with annual compaction. Typical growth: 500KB per 1000 requests raw; 2KB per 1000 requests aggregated. Plan 2-5TB/year for 10M requests/day.
Production Best Practices
Security & Access Control
Dashboards containing per-tenant cost data are high-value attack targets for competitive intelligence. Implement row-level security in ClickHouse (or equivalent) tied to identity provider groups. Quality scores for unreleased models require additional ACL layer—evaluators may run against preview APIs with embargoed pricing.
Testing & Validation
- Shadow mode deployment: Run dashboard and alerting logic parallel to existing systems for 2 weeks; compare alert precision/recall against manual incident log.
- Chaos testing: Inject synthetic cost spikes (10× normal) and quality drops (randomized outputs) during low-traffic windows; verify alert firing and auto-actuator response within SLO.
- Evaluator A/B testing: When upgrading LLM-as-judge version, run old and new evaluators in parallel for 1 week; establish score mapping to prevent baseline disruption.
Runbook: Dual Regression Alert Response
- T0 (alert fires): Acknowledge, check
modelandprompt_template_versiontags for recent deployment. - T+2 min: If deployment correlated, execute rollback if automated; if not, check provider status page for regional degradation.
- T+5 min: If provider healthy, inspect
completion_ratio—spike suggests prompt injection or context overflow; drop suggests truncation from max_tokens. - T+10 min: If root cause unclear, enable 100% quality evaluation sampling for affected tenant/model combination; disable auto-downgrade to prevent oscillation.
- T+30 min: Post-incident, update runbook with specific diagnostic query; schedule baseline recalibration if model version changed.
Organizational Integration
The FinOps practice for LLM token costs and unit economics must own dashboard KPI definitions, while AI Engineering owns quality evaluation pipelines. Joint weekly review of cost/quality Pareto frontier prevents siloed optimization—FinOps driving cost down without quality visibility, or AI Engineering optimizing benchmark scores without cost constraint.
Further Reading & References
- Anthropic API Documentation: Prefix Caching. https://docs.anthropic.com/en/docs/build-with-claude/prompt-caching — authoritative source for cached token pricing mechanics.
- LangSmith Evaluation & Monitoring. https://docs.smith.langchain.com/ — managed implementation reference for quality evaluation pipelines.
- "LLM-as-a-Judge" Reliability Study. Zheng et al., 2023. https://arxiv.org/abs/2306.05685 — academic grounding for evaluator confidence calibration.
- OpenTelemetry Semantic Conventions for GenAI. https://opentelemetry.io/docs/specs/semconv/gen-ai/ — emerging standard for trace attribute naming.
- ClickHouse Materialized Views: Best Practices. https://clickhouse.com/docs/en/materialized-view — technical reference for aggregation pipeline implementation.
- Google SRE Book: Alerting on SLOs. https://sre.google/workbook/alerting-on-slos/ — foundational dual-threshold alerting pattern adapted for cost/quality.


