
AIOps Platforms: Intelligent Observability for 2026
Introduction
Problem statement: Modern production stacks—hybrid cloud + edge + LLMs—produce signals at a rate and variety that outstrip traditional monitoring, leaving teams blind to emergent failures.
Promise: This article explains how AIOps platforms enable intelligent observability in 2026, with pragmatic implementation patterns, measurable KPIs, decision checklists, failure diagnostics, and code examples you can run in production.
Failure scenario (realistic): A retail platform running a mixture of Kubernetes services, a legacy virtual machine batch pipeline, and a private LLM inference cluster sees intermittent latency spikes during promotion traffic. Alert noise hides the true issue: a degraded model pod that enters CPU thrashing, perturbing Redis cache and database connection pools. Existing alert rules fire but cause fatigue; by the time engineers investigate, p99 latency is doubled and revenue is affected. An intelligent observability platform with integrated anomaly detection and root cause analysis would correlate signals across traces, metrics, logs and model telemetry to surface the causal chain—model CPU thrash → Redis eviction storm → DB connection saturation—and recommend the remediation path.
Executive Summary
TL;DR: In 2026, AIOps platforms combine cross-signal ingestion, causal tracing, and adaptive ML to provide actionable, ranked root cause analysis and automated remediation playbooks—reducing MTTI and MTR by an order of magnitude when integrated correctly.
- Key takeaway 1: AIOps platforms centralize high-cardinality telemetry (traces, metrics, logs, events, model telemetry) and apply hybrid ML (statistical + LLM reasoning) to produce ranked, actionable RCA.
- Key takeaway 2: The most effective systems use eBPF for non-intrusive observability, OpenTelemetry for standard signal collection, and model inference close to the data plane for low-latency detection.
- Key takeaway 3: Operationalizing AIOps requires data hygiene—semantic labeling, consistent trace IDs, and sampling policies—to prevent model drift and alert fatigue.
- Key takeaway 4: Choose platforms by SLA alignment, data locality (hybrid cloud requirements), and explainability—differentiators in 2026 include causal graphs + verifiable evidence traces.
- Key takeaway 5: Performance targets: p95 detection latency < 30s for streaming anomalies, p99 < 2m for cross-signal RCA; maintain telemetry ingestion tail latencies under 250ms for critical paths.
Quick Q→A (likely direct queries)
- Q: What is an AIOps platform? → A: A system combining telemetry ingestion, feature engineering, ML-based anomaly detection, causal analysis, and remediation automation to reduce incident detection and resolution time.
- Q: Can AIOps work in hybrid cloud? → A: Yes—hybrid deployments require local inference nodes, federated feature stores, and encrypted, minimal metadata exchange to meet data residency needs.
- Q: How does AIOps improve root cause analysis? → A: By correlating high-cardinality signals, building causal graphs, and using explainable ML to produce ranked hypotheses with supporting evidence (traces, logs, metric deltas).
How AIOps Platforms for Intelligent Observability in 2026 Works Under the Hood
Architecturally, contemporary AIOps platforms are pipeline-oriented systems made of four layers: collection, enrichment, analytics, and action. Each layer must be optimized for scale, explainability, and hybrid deployment.
- Collection (data plane): Agents (OpenTelemetry), eBPF probes for kernel-level signals, model telemetry emitters for LLMs/microservices, and cloud-native exporters. This layer prioritizes low-overhead capture, consistent IDs, and schema enforcement.
- Enrichment (stream processing): Real-time feature extraction, cardinality reduction, dynamic sampling, and join logic to link traces, logs, and events. Stream layers often run with Flink/Beam or purpose-built streaming engines optimized for stateful aggregation.
- Analytics (AIOps brain): A mix of online detection models (statistical change detectors, streaming clustering, isolation forests), causal inference engines (e.g., constraint-based or Granger-causality augmented by instrumentation), and LLM-based summarizers that create human-readable RCA hypotheses.
- Action (automation & workflows): Playbooks, runbooks, and automated mitigations exposed via orchestration (Kubernetes operators, runbook automation). Auditability and safety gates are essential—remediation suggestions should be human-verified for high-risk actions.
Algorithms and protocols: Real-time anomaly detection uses streaming complexity O(n · d) per timestep for naive feature calculation, but practical systems use windowed aggregates and sketching (count-min, HyperLogLog) to reduce complexity. Causal analysis leverages graph construction from trace spans and dependency graphs; approximate causal edges are scored using conditional independence tests and time-lagged correlations, then validated against historical incident patterns stored in vectorized incident stores.
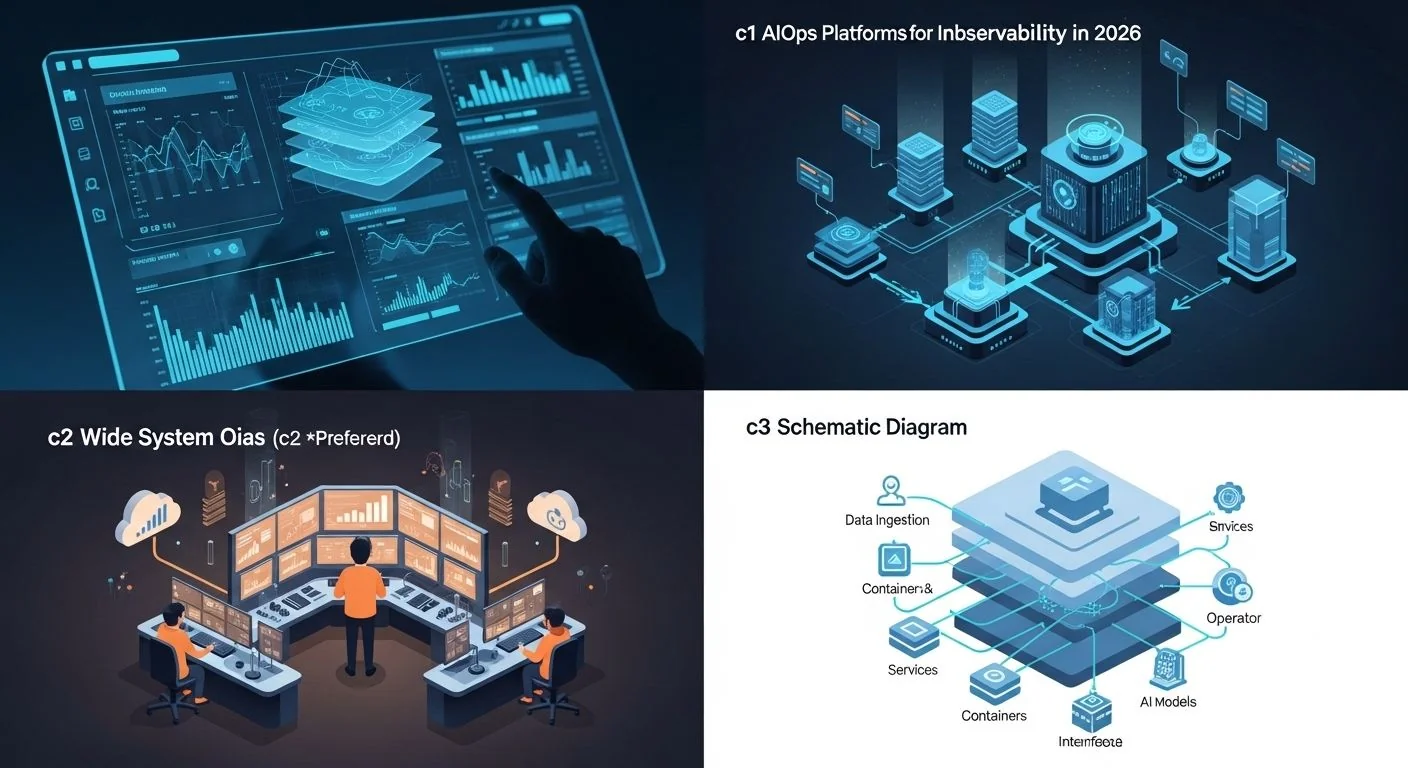
Diagram description (text): Imagine a four-layer stack left-to-right: collectors (OTel agents + eBPF + app hooks) feed the streaming enrichment plane where a stateful aggregator computes features and stores short-term state. Enriched features feed both online detectors (stream models) and a model store for batch retraining. Detectors emit alerts to the analytics orchestrator that merges evidence into a causal graph; an LLM summarizer generates an RCA draft. The action layer maps RCA to playbooks and can trigger remediation via runbook APIs.
Implementation: Production Patterns
Below are stepwise patterns from basic to advanced, with snippets for an OpenTelemetry + lightweight anomaly detector pipeline.
Basic: Ingest and detect
- Install OpenTelemetry collectors on nodes and instrument critical services with semantic span attributes (service.name, endpoint, model.id).
- Send metrics to a scalable time-series backend (Prometheus remote-write, Cortex) and logs/traces to a distributed store (e.g., Tempo, Loki, or vendor-managed storage).
- Run a streaming detector that computes z-score over rolling windows for key SLO metrics.
# Pseudocode: a simple streaming z-score detector (conceptual)
window = 5m
stream = subscribe(metric_path='service.*.latency')
for datapoint in stream:
    stats = rolling_stats(datapoint.key, window)
    z = (datapoint.value - stats.mean) / stats.std
    if z > 4:
        emit_alert({ 'key': datapoint.key, 'z': z, 'evidence': stats.summary })
Advanced: Correlation and causal graph
- Enrich traces with model telemetry: model version, input size, latency, memory usage.
- Use eBPF to capture network connect/close rates and syscall latencies for host-level context without changing apps (low overhead).
- Build a streaming join across traces, metrics, and logs keyed by trace_id and service boundary to construct candidate causal edges.
# Simplified example: join traces with model telemetry
traces = subscribe('traces')
model_telemetry = subscribe('model_telemetry')
joined = stream_join(traces, model_telemetry, key='trace_id', window=30s)
for item in joined:
    features = extract_features(item)
    score = causal_scorer(features)
    if score > threshold:
        create_rca_hypothesis(item.trace_id, score, item.evidence)
Note: In production, stream_join must be implemented with bounded state and tombstoning to avoid unbounded memory; use keyed windows and watermarking.
Error handling & optimization
- Design for graceful degradation: when enrichment backends are slow, switch to summary-only features (e.g., histograms) and increase detection thresholds to reduce false positives.
- Cardinality explosion mitigation: enforce tag whitelists, use tag-rollups, and employ feature hashing for rare dimensions.
- Retraining schedule and model governance: log predictions and label outcomes to a feature store; retrain deterministic detectors weekly and adaptive models daily depending on concept drift metrics.
Example: rolling back an auto-remediation when rollback exception rate > 0.1%:
# Pseudocode: safe remediation gating
if rca.confidence > 0.85 and risk_score < 0.2:
    action = select_playbook(rca)
    result = execute(action)
    if result.status == 'failure' and result.error_rate > 0.001:
        rollback(action)
        notify(oncall, reason='remediation failed')
Comparisons & Decision Framework
By 2026 the ecosystem has matured: commercial AIOps vendors, open-source projects, and cloud-managed offerings each have distinct tradeoffs. Use this checklist to evaluate platforms against your needs.
Selection checklist (must-have vs nice-to-have)
- Data plane compatibility: Does the platform accept OpenTelemetry, eBPF-derived metrics, and model telemetry? (Must)
- Hybrid cloud support: Can the platform run inference locally (on-prem) and coordinate across clouds without exfiltrating PII? (Must for regulated workloads)
- Explainability: Are RCA outputs accompanied by evidence traces and a ranked causal graph? (Must)
- Remediation safety: Does the platform support safe, auditable remediation with rollback? (Must)
- Performance: Can it meet your p95 detection latency and ingestion throughput at peak? (Must)
- Integrations: Kubernetes, Prometheus, SIEM, runbook orchestration. (Nice-to-have)
- LLM-assisted summarization: Are explanations grounded with verifiable citations from telemetry? (Nice-to-have but increasingly common)
Trade-offs
- Open-source stacks offer control and auditability; commercial platforms provide integrated UI and faster time-to-value but may require more trust and data movement.
- Edge/hybrid setups often need local inference—trades off model freshness for data residency and latency.
- LLM summarizers improve readability but can hallucinate; enforce evidence links and grounding to telemetry to reduce risk.
For hands-on comparison of vendor-style features, see our analysis of current AI observability options and how they stack up in advanced systems like Kubernetes environments in AI Observability Platforms 2026: Braintrust vs Arize Phoenix vs Lan.... For OpenTelemetry-native approaches to LLM tracing and observability, consult OpenTelemetry AI: Native LLM Tracing & Observability, which covers specific instrumentation patterns for LLMs.
Failure Modes & Edge Cases
Concrete diagnostics and mitigations matter. The following are the common failure modes observed in production AIOps deployments and how to respond.
- False positives from noisy features
- Symptom: Surge of low-confidence alerts tied to high-cardinality attributes (user.id, request_id).
- Diagnosis: Check feature importance and per-feature alert counts; high entropy features often cause noise.
- Mitigation: Apply cardinality controls, use aggregated rollups, and require multi-signal corroboration (metric + trace + log) before alerting.
- Model drift and obsolete baselines
- Symptom: Increasing false negatives observed after deployment of a new model version or traffic shift.
- Diagnosis: Compare recent prediction distributions against baseline via population stability index (PSI) and KL divergence.
- Mitigation: Implement automatic retraining triggers when PSI > 0.25, and keep a hot rollback model in production.
- Telemetry ingestion backlog
- Symptom: Rising ingestion latency and missing evidence for RCA.
- Diagnosis: Inspect collector queue lengths and backpressure metrics; confirm storage write latencies.
- Mitigation: Enable adaptive sampling, increase retention for critical spans only, use burst buffers on collectors.
- LLM hallucination in RCA
- Symptom: Human-readable RCA statements that assert false facts not present in telemetry.
- Diagnosis: Verify each LLM-summarized claim against evidence links; check token likelihoods and prompts used.
- Mitigation: Enforce grounding: require LLM outputs to include citations (trace IDs, log excerpts) and add a validation layer that rejects outputs without matching evidence.
Performance & Scaling
Performance engineering for AIOps combines telemetry throughput, detection latency, and RCA completeness. Set clear KPIs and design the pipeline to meet them.
Recommended KPIs
- Ingestion throughput: design for sustained 50k–500k events/sec depending on scale; use partitioned streams.
- Detection latency: p95 < 30s for streaming anomaly detection; p99 < 2m for cross-signal RCA synthesis.
- Evidence retrieval: p95 search latency < 250ms for critical traces to keep interaction loops fast for SREs.
- False positive rate (FPR): target < 2% for critical SLOs, balance with detection sensitivity.
- Model retrain cadence: weekly for feature-stable environments, daily for highly dynamic ones (LLM infra, user-facing models).
Scaling patterns
- Partition stream processing by service name or tenant to limit cross-scope state explosion.
- Use approximate data structures (sketches, Bloom filters) to track heavy hitters for cardinality reduction.
- Place inference as close to the data source as possible: edge inference for latency-sensitive checks; centralized inference for global correlation.
Example metrics and targets in a medium-scale deployment (100 microservices):
- Telemetry volume: ~5M events/day (traces+metrics+logs) → pipeline must support 70 events/sec sustained with spikes to 2k/sec.
- Storage: short-term hot store (7–30 days) for trace evidence; long-term cold store for incidents and training data.
- Compute: streaming cluster sized to keep state per key < 100KB; if more, shard keys further.
Production Best Practices
Security, testing, rollout, and runbooks are non-negotiable for AIOps platforms.
- Security & Compliance: Encrypt telemetry in transit, role-based access control for RCA outputs, and minimize PII in telemetry. For regulated setups, use federated feature stores and local inference to keep raw data on-prem.
- Testing: Unit test detectors with synthetic incidents; use chaos experiments (latency injection, service kill) to validate detection and playbooks.
- Rollout: Canary anomaly detectors with shadow mode for at least 2–4 weeks; monitor precision/recall before switching to enforcement/remediation.
- Runbooks: Every automated remediation must map to a documented runbook with human-readable steps, rollback criteria, and post-incident audits.
- Observability for the observability stack: Instrument the AIOps pipeline itself—track detector prediction latencies, ingest queue length, false positive counts, and RCA verification rates.
Operational checklist (short):
- Semantic tagging standards adopted across teams
- Telemetry retention & cold storage policy
- Canary/Shadow testing for detectors
- Audit logs for automated remediation
Further Reading & References
Primary sources and deeper dives:
- Comparison of AI observability vendors and their approaches to Kubernetes — vendor feature analysis and field trial notes.
- OpenTelemetry AI: Native LLM Tracing & Observability — instrumentation patterns and tracing LLM inference for production.
- eBPF AI Observability: Trace Model Inference End-to-End — using eBPF to capture low-level signals for causal analysis.
- OpenTelemetry project docs — signal collection standards and semantic conventions.
- Prometheus and Cortex documentation — best practices for high-scale metric ingestion and remote-write.
Closing note from the MAKB editorial desk: In 2026, successful AIOps adoption is as much about organizational practices—data hygiene, runbook discipline, and trust boundaries—as it is about selecting the latest ML model. Treat the platform as a production service: instrument it, test it, and align SLAs. The benefit is concrete: faster detection, fewer escalations, and measurably shorter MTTI/MTR.


